


A new Enphase solar owner asked Reddit users to explain a confusing energy-flow diagram in the company's app.
The uncertainty presented in the r/enphase community highlighted a common challenge for beginners trying to understand what their systems are generating, using, importing, and sending back to the grid.
Here's what to know
The user asked the community: "Can y'all explain what this diagram means? In laymen's terms. I've never had solar before and trying to understand what all this means and how to maximize the solar generation."
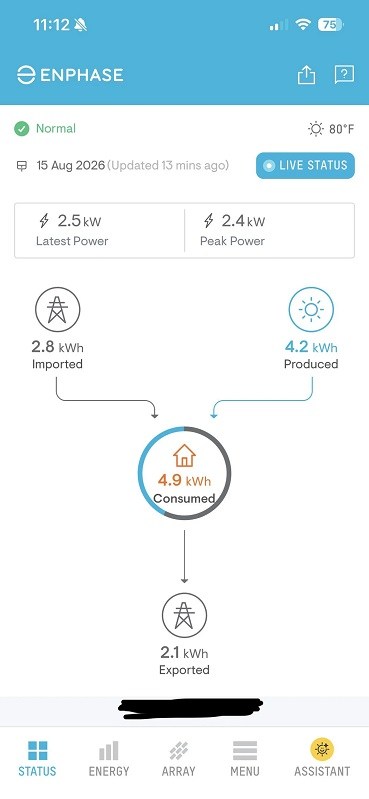
Seasoned commenters said it showed the home used 4.9 kilowatt-hours, the panels generated 4.2 kWh, the grid supplied 2.8 kWh, and the setup sent 2.1 kWh to the grid.
In other words, the display consisted of a flow chart for their electricity. For this home, solar covered some of the demand, utility power supplied the remainder, and excess solar that was not needed was exported to the grid.
"Due to a mismatch between when the sun shines (and your solar generated power) and when you use electricity, some of it is imported and exported to the grid," a user explained.
TCD Picks » Quince Spotlight
💡These best-sellers from Quince deliver affordable, sustainable luxury for all




More background
New solar owners often expect their panels to replace grid electricity altogether, but home energy use and solar production usually do not line up perfectly. Unless a system has enough battery storage and generation capacity, most homes will still pull power from the grid at some times and send extra power back at others.
This graphic showed that timing problem clearly. Half of the solar output was generated when the home did not need it. If that homeowner had moved as much as 2.1 kWh of usage into sunnier hours, they could have cut later grid purchases by a similar amount, which may have lowered their utility bill.
Knowing when your panels produce the most electricity can help you choose when to run appliances, charge devices, and cool the house.
"You can't really change how much you generate (aside from adding more PV panels + micros)," a user wrote. "You could try to shift consumption (doing laundry, running the AC, etc.) to early afternoon to use up as much of your own production."
The other commenter noted that the Enphase app offers a detailed breakdown, saying, "If you click on the energy tab, you can see a bar graph of your import, export, and generated solar for 15-minute intervals."
What can be done?
For most homeowners, the most practical lever is when electricity gets used, not how much panels generate. Load shifting can be especially useful for people who do not receive full credit for exported electricity.
If your utility pays less for power sent back to the grid than it charges you to buy power, using your own solar is often the better financial move.
Batteries are another option, but commenters said the value depends on local utility rules, equipment costs, and whether backup power matters to you.
"Otherwise with 1-to-1 net metering, the grid is your battery," someone wrote.
The app is not just a dashboard; it can serve as a guide that shows when the cheapest energy is available.

Get TCD's free newsletters for easy tips, smart advice, and a chance to earn $5,000 toward home upgrades. To see more stories like this one, change your Google preferences here.