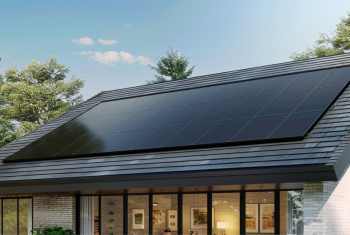


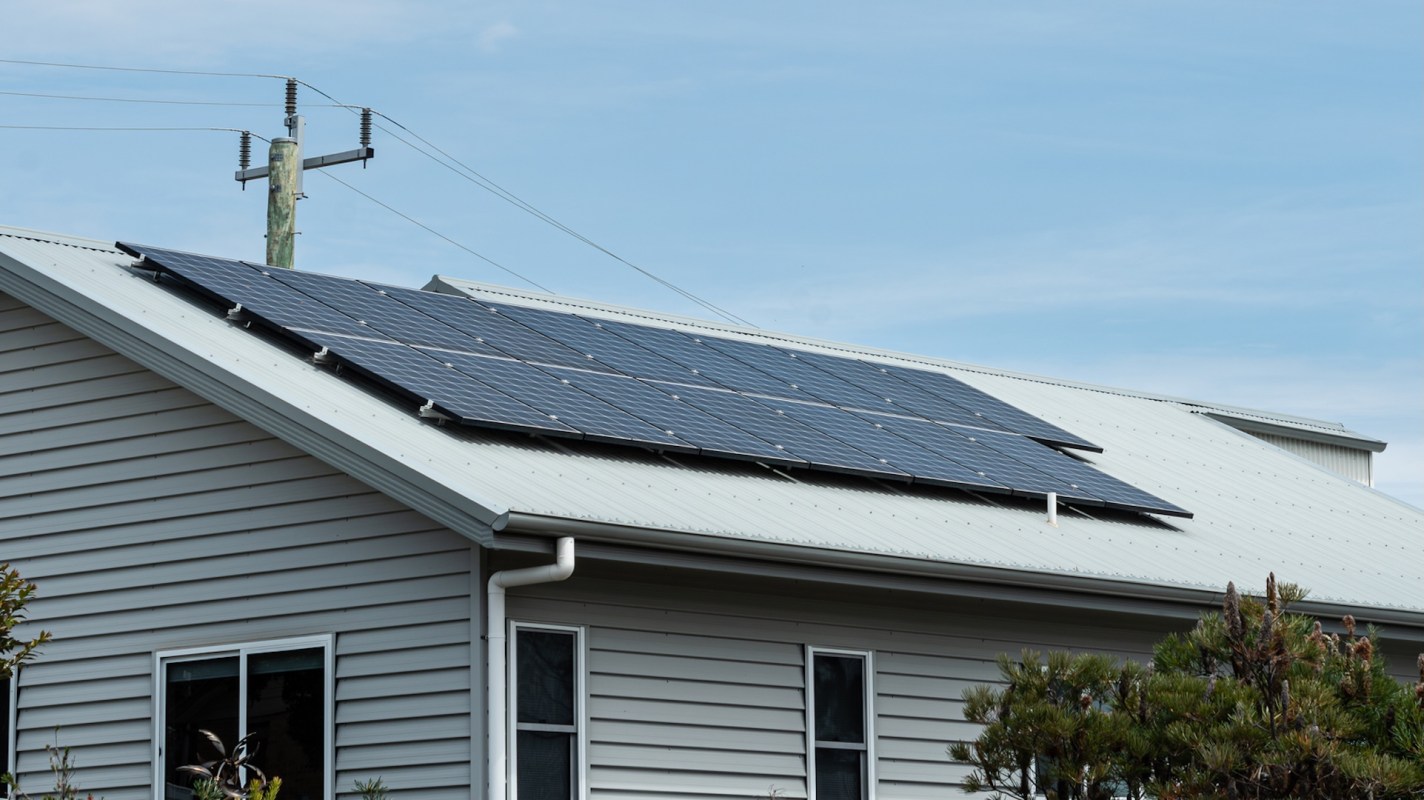
Rooftop solar is reshaping New England's electric grid: The region has recorded 500 duck curve days, showing that sunshine is cutting daytime demand so much that midday power use drops below overnight levels.
The milestone shows that small-scale solar systems on homes and businesses are no longer a niche part of the energy mix. They are changing when the grid is busiest and how electricity is supplied.
Here's what to know
A duck curve happens when behind-the-meter solar panels produce enough power to meet midday demand on the broader grid, but not overnight demand. According to ISO New England, the region's 500th such day was Sept. 21, the 107th duck curve day of 2026.
What was once a slow-building trend is now speeding up: after ISO New England recorded its first duck curve on April 21, 2018, it took nearly five years for the region to reach 100 such days. The next 100 arrived in about 13 months, and the climb from 400 to 500 took only 221 days.
Mike Knowland, ISO-NE's manager of Forecast & Scheduling, said more of these days are likely ahead.
"We're seeing more behind-the-meter solar every year, and we expect that trend to continue," he said.
TCD Picks » Quince Spotlight
💡These best-sellers from Quince deliver affordable, sustainable luxury for all




He added: "The 500th duck curve could have come earlier, but there were a lot of cloudy days this year."
More background
The shift is also changing how grid operators think about reliability and pricing. In places such as Massachusetts, where many households buy electricity tied to broader grid conditions, lower midday demand can shift when peak pricing pressure emerges.
Duck curves can now appear in any season and on any day of the week when skies are clear and weather-related demand remains limited. Earlier, they were more commonly associated with spring weekends, when solar generation was strong and demand for heating or air conditioning stayed relatively low.
The region's most pronounced duck curve happened around 2 p.m. on Easter Sunday, April 20, 2025, when system demand dropped to a record-low 5,318 megawatts.
What can be done?
If you're considering panels for your own home, EnergySage can help you compare competitive bids from local installers without giving up your contact information unless you decide to move forward with one. That kind of comparison shopping can make going solar less intimidating and more affordable.
Knowland expects additional duck curve days as behind-the-meter solar keeps growing.
Where can I learn more?
These stories follow the same rooftop solar growth driving New England's duck curve days. They show how that shift is affecting power costs, battery demand, and household energy use across the region.
• Across New England, rooftop panels cut heat wave power costs by $130 million and sometimes beat nuclear.
• In Massachusetts, solar charts showed rooftop panels supplied nearly a quarter of New England's peak power.
• In Connecticut, a new solar bill gives home batteries a major advantage as rooftop incentives hit caps.
• On Cape Cod, one homeowner says solar and mini-splits could leave him 4,100 kWh ahead.

Get TCD's free newsletters for easy tips, smart advice, and a chance to earn $5,000 toward home upgrades. To see more stories like this one, change your Google preferences here.